Know if your
is truly profitable — without building a finance team.
Margofy turns your sales, delivery, labor, bank, and expense data into monthly dashboards, margin insights, and practical recommendations built for busy food business owners.

The problem
Most food business owners see sales.
Few see true profit.
Owners have POS reports, delivery deductions, payroll, and expense files scattered across systems — but no simple monthly view of what they're actually earning.
POS sales don't show real profit
Top-line revenue looks healthy, but you can't see what's actually left after costs.
Delivery fees hide margin leakage
Commissions, marketing spend, and amendments quietly cut into every order.
CPA reports arrive too late
Year-end filings can't help you fix labor or food cost mid-month.
Costs are spread across files
POS reports, payroll, bank statements, expenses — no single P&L view.
The solution
Your food business numbers in one clear monthly view.
Margofy converts the reports you already have into a food business-specific Profit and Loss (P&L), with the cost drivers and margins called out.
Features
Everything an owner needs. Nothing they don't.
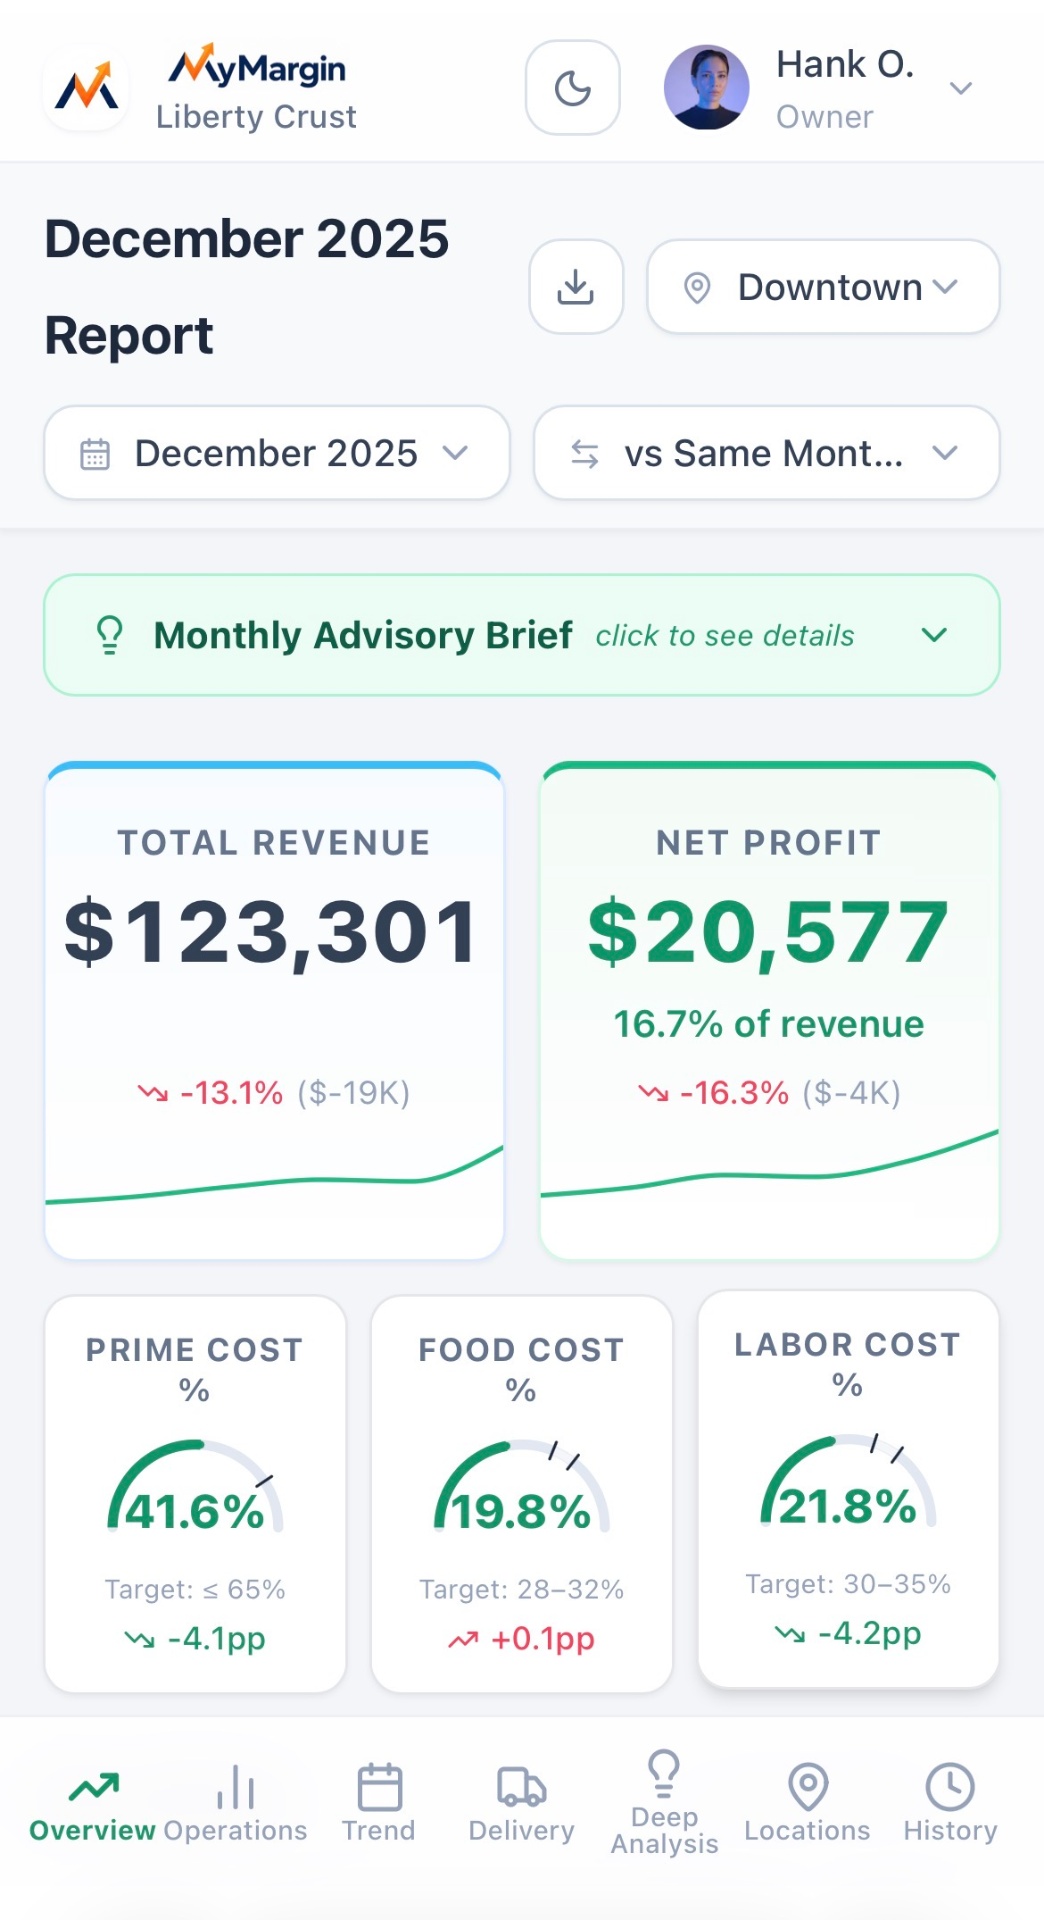
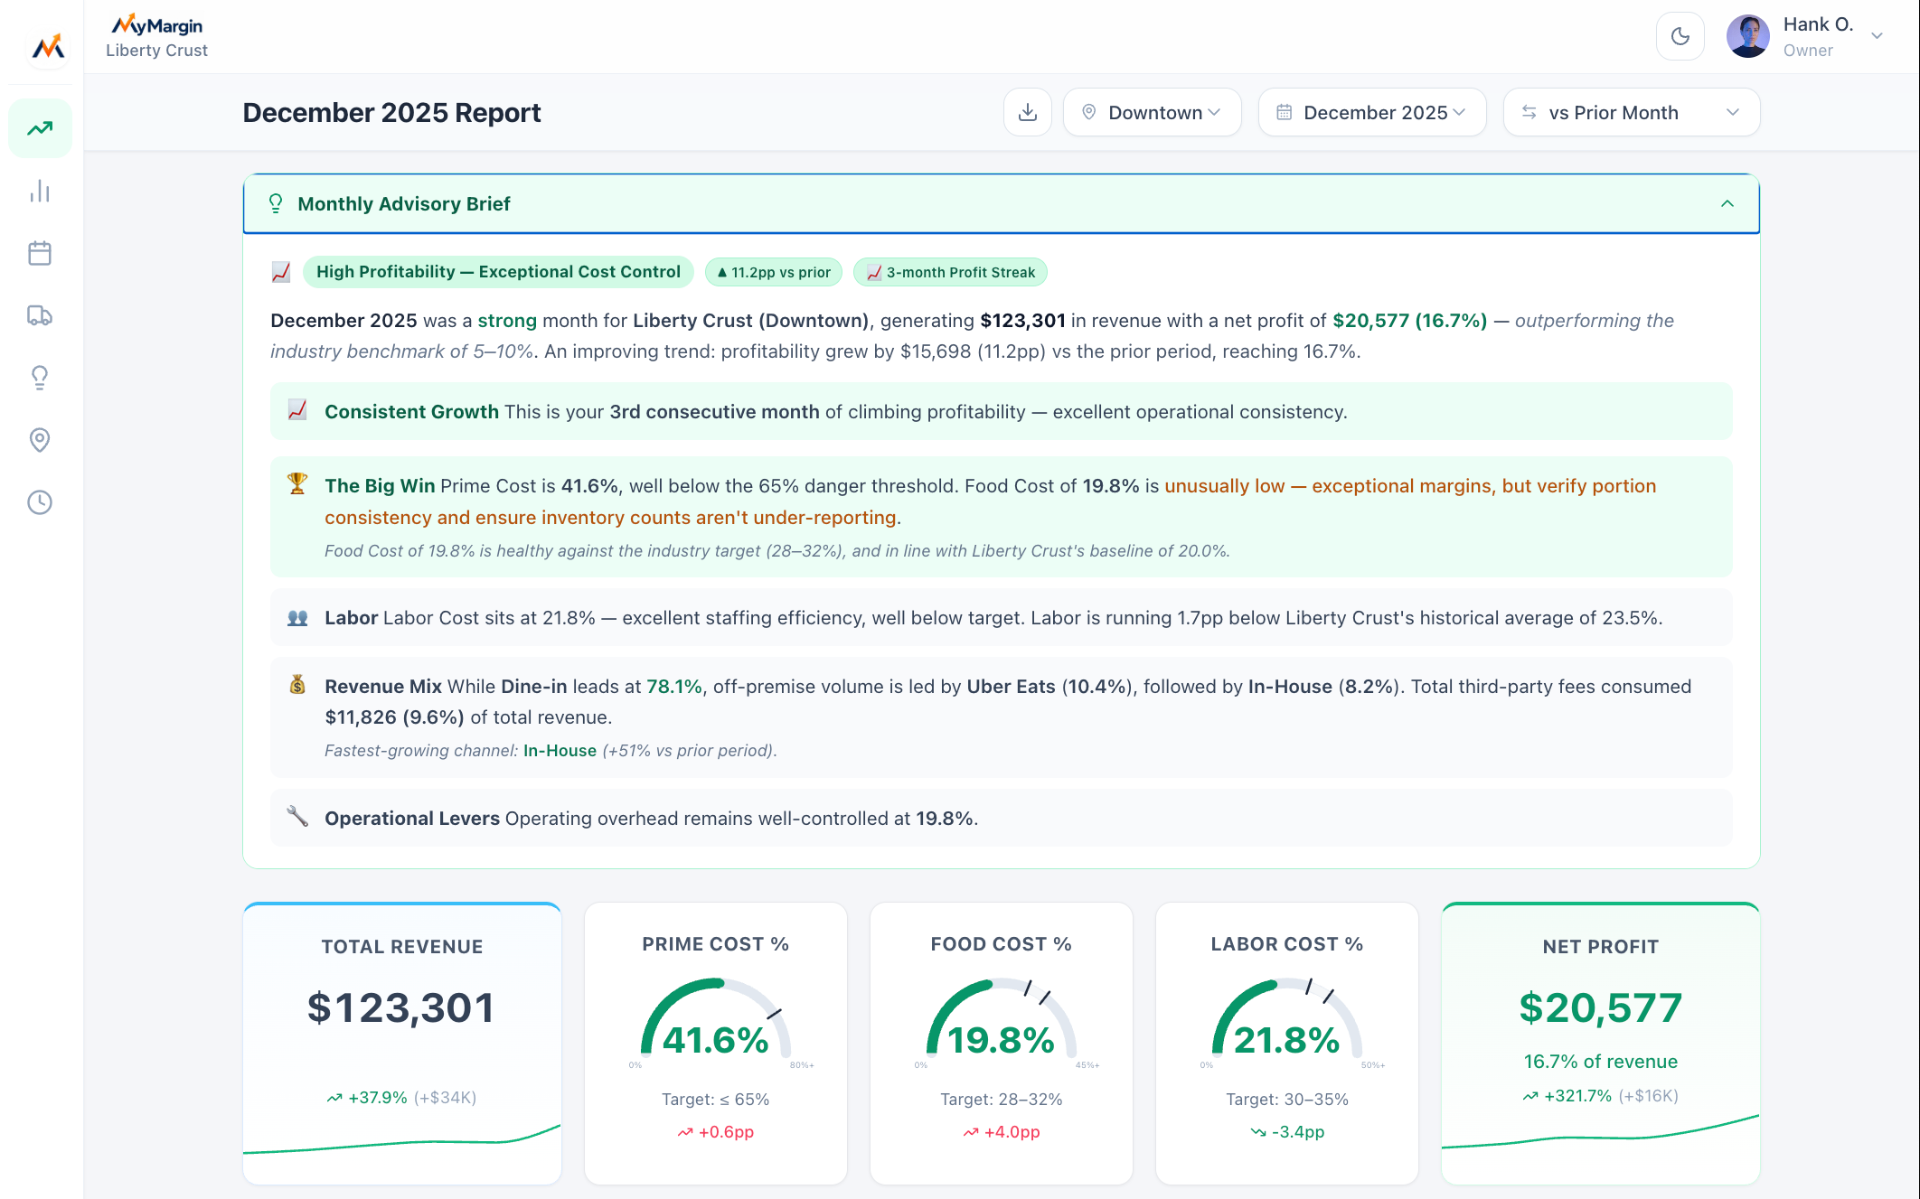
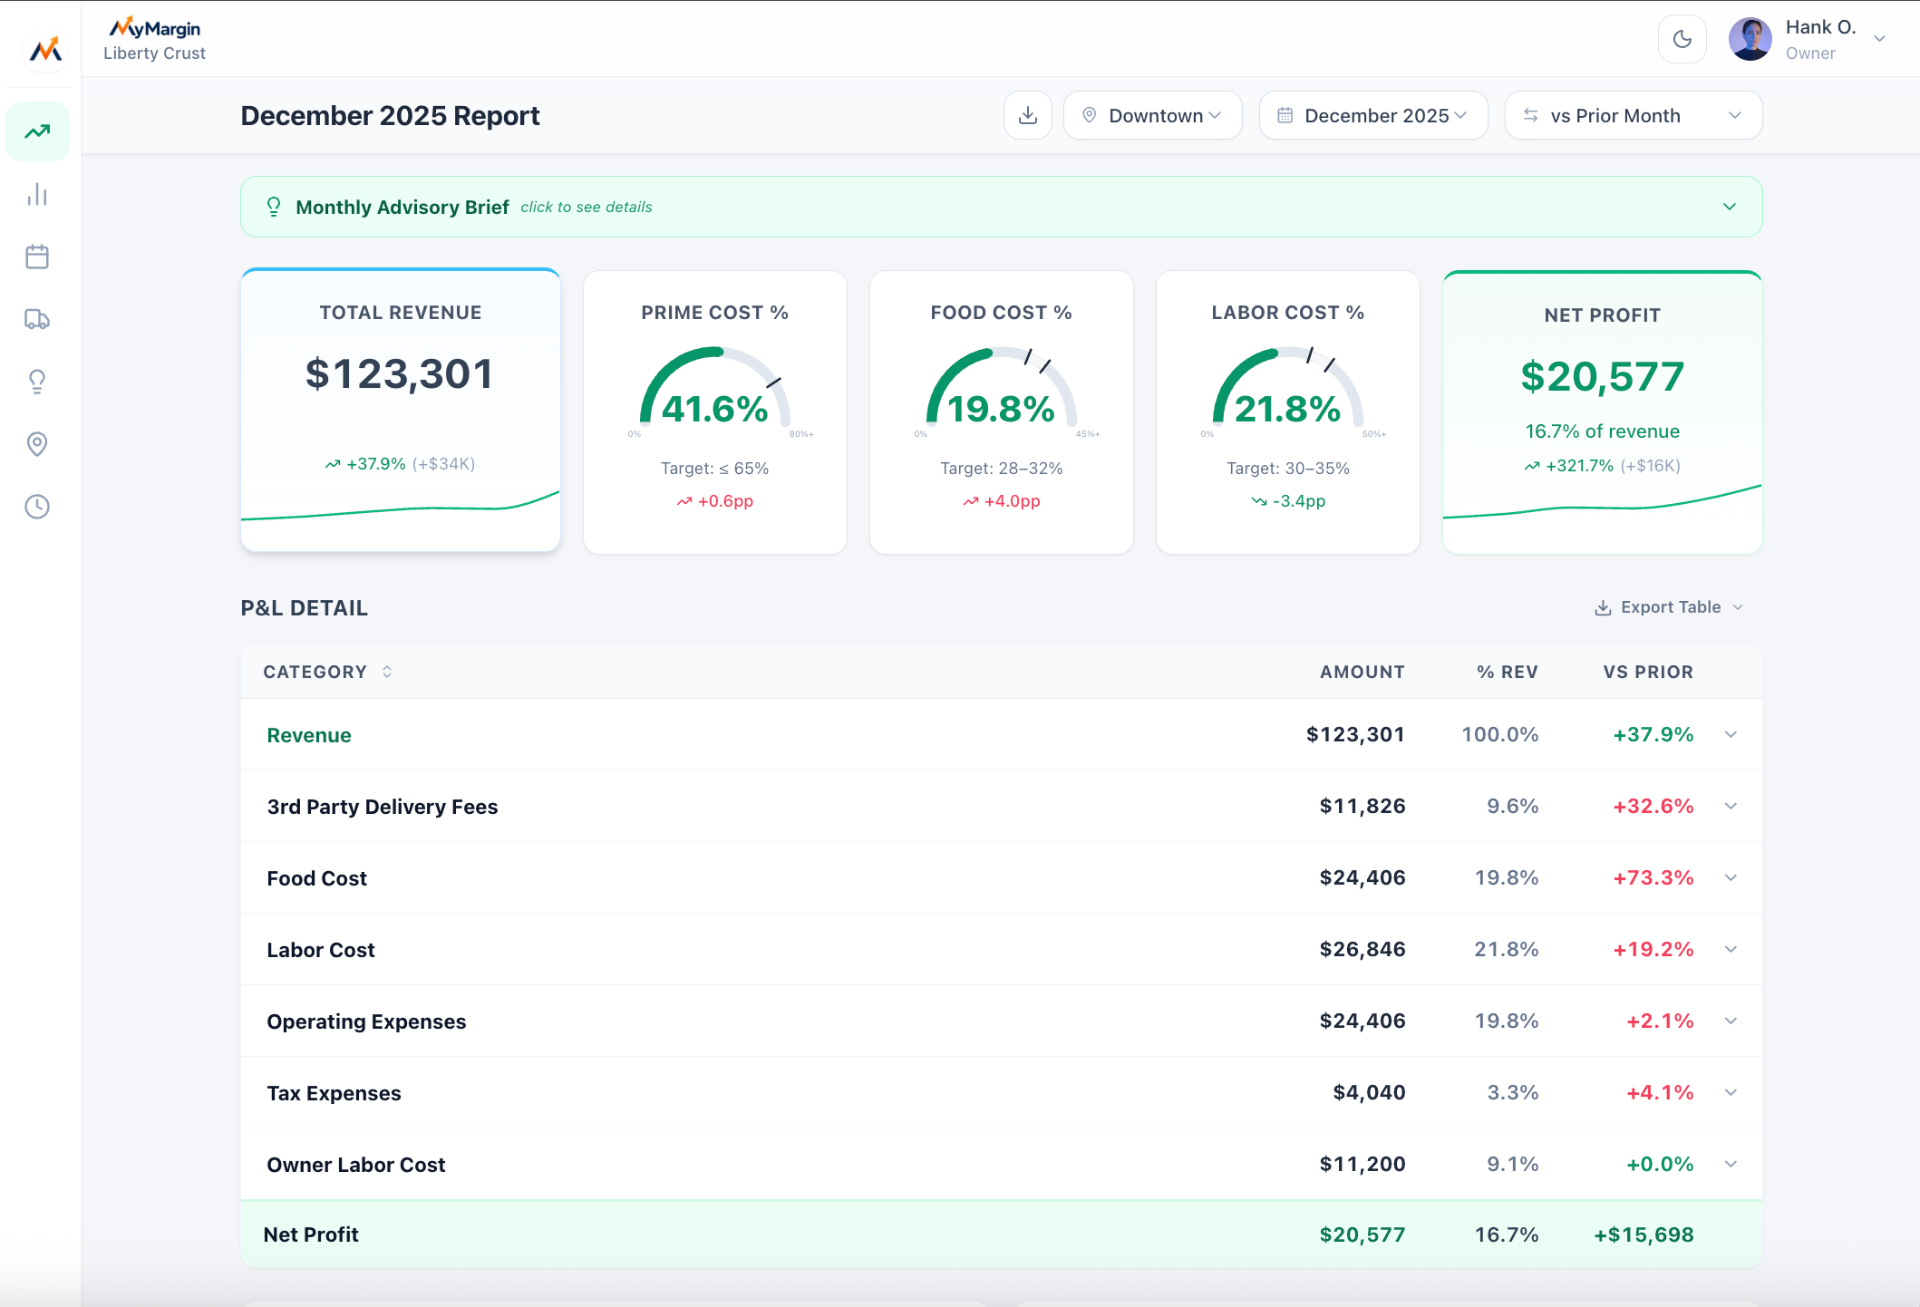
Profit Dashboard
Sales, expenses, margins, and net profit — one clean view.
Stop reconciling four reports. See revenue, prime cost, food cost, labor, and net profit side by side, with monthly trend at a glance.
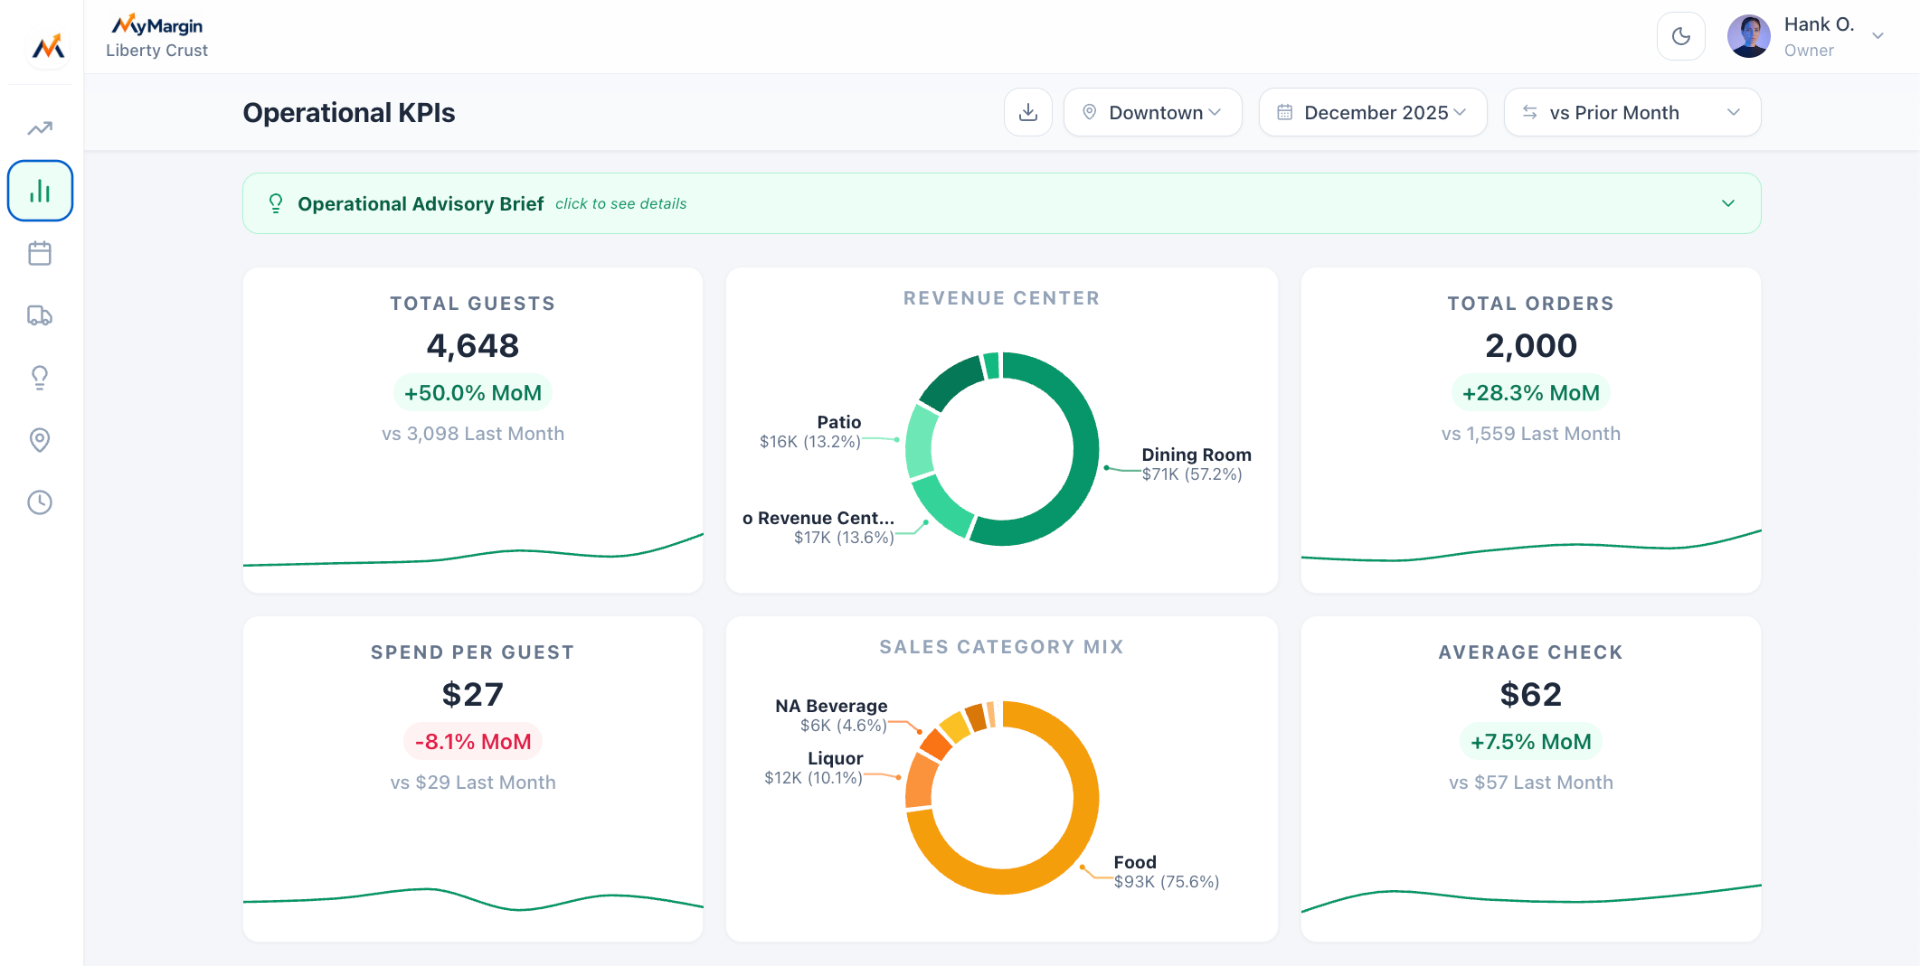
Operational Performance
See what is driving sales and guest activity.
Track guest volume, order activity, average check, spend per guest, and sales mix in one clear view. Understand what is changing across your operation and where to focus next.
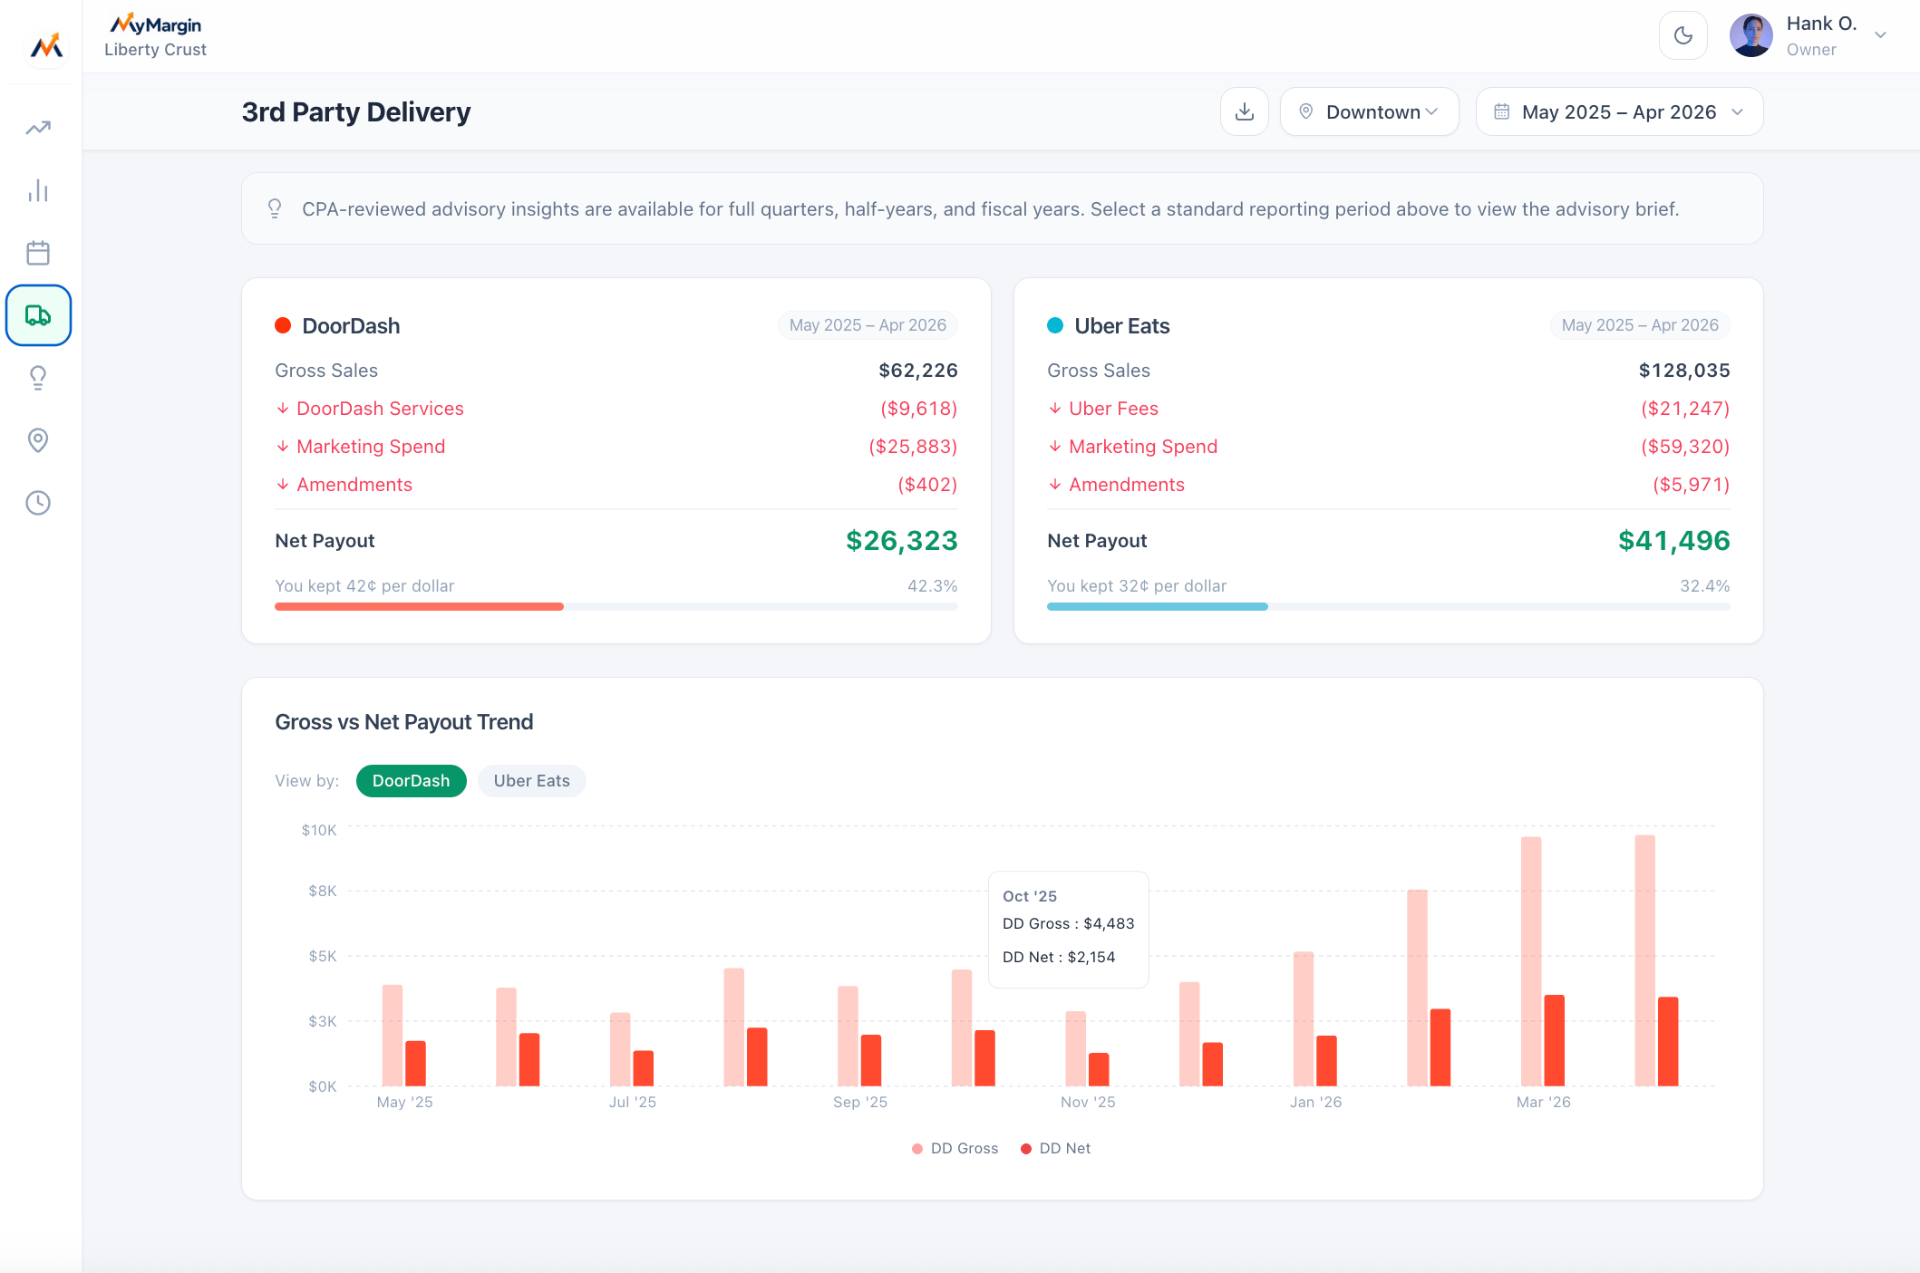
Delivery Channel Visibility
See what third-party platforms really cost you.
Net payout after commissions, marketing spend, and amendments — by channel, by month, with gross vs net trend.
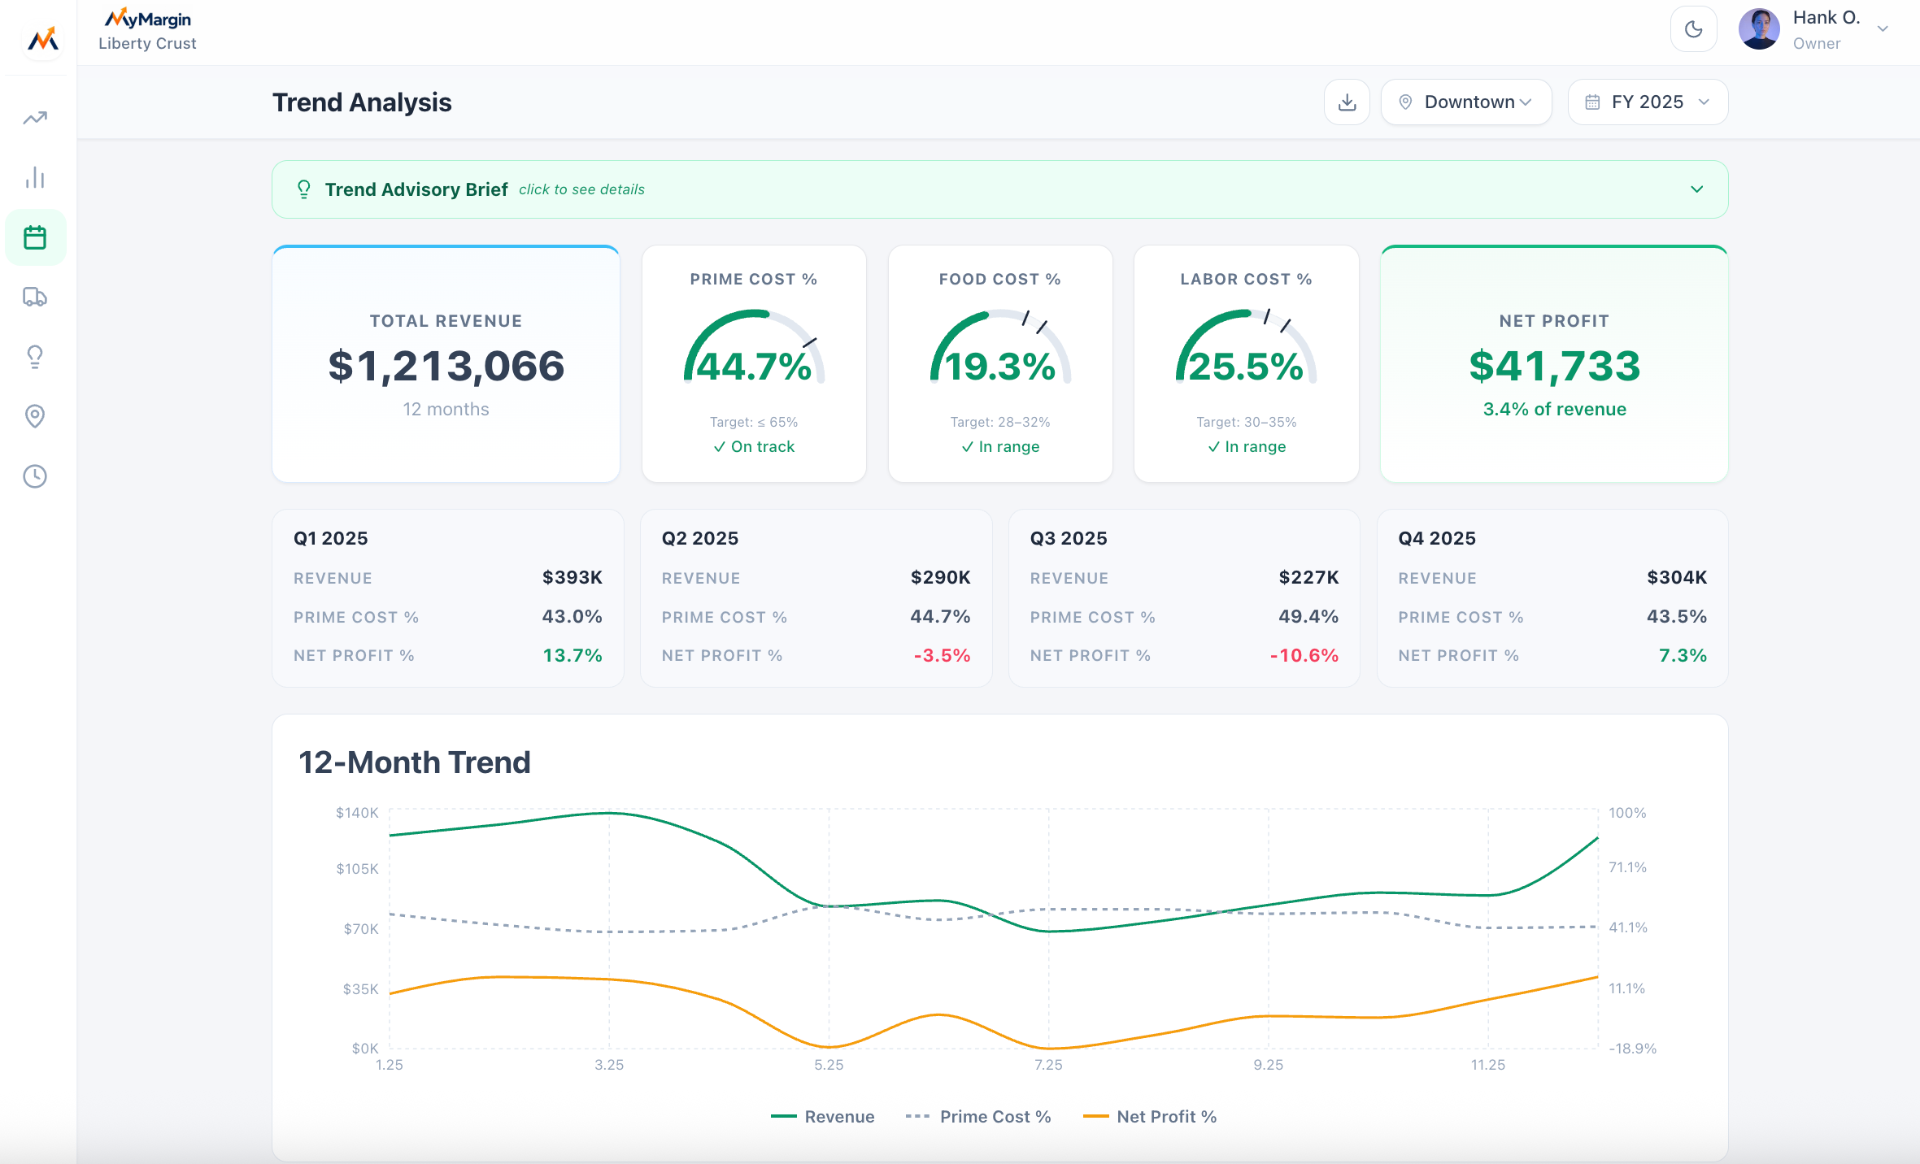
Monthly Trend Analysis
Compare current month, prior month, and prior year.
Daypart and day-of-week views show when revenue actually comes in — so labor and prep decisions become obvious.
Owner-Friendly Recommendations
Plain-English notes on what changed and what to do.
No accounting jargon. Each insight tells you the cost driver, the magnitude, and the next action worth reviewing.
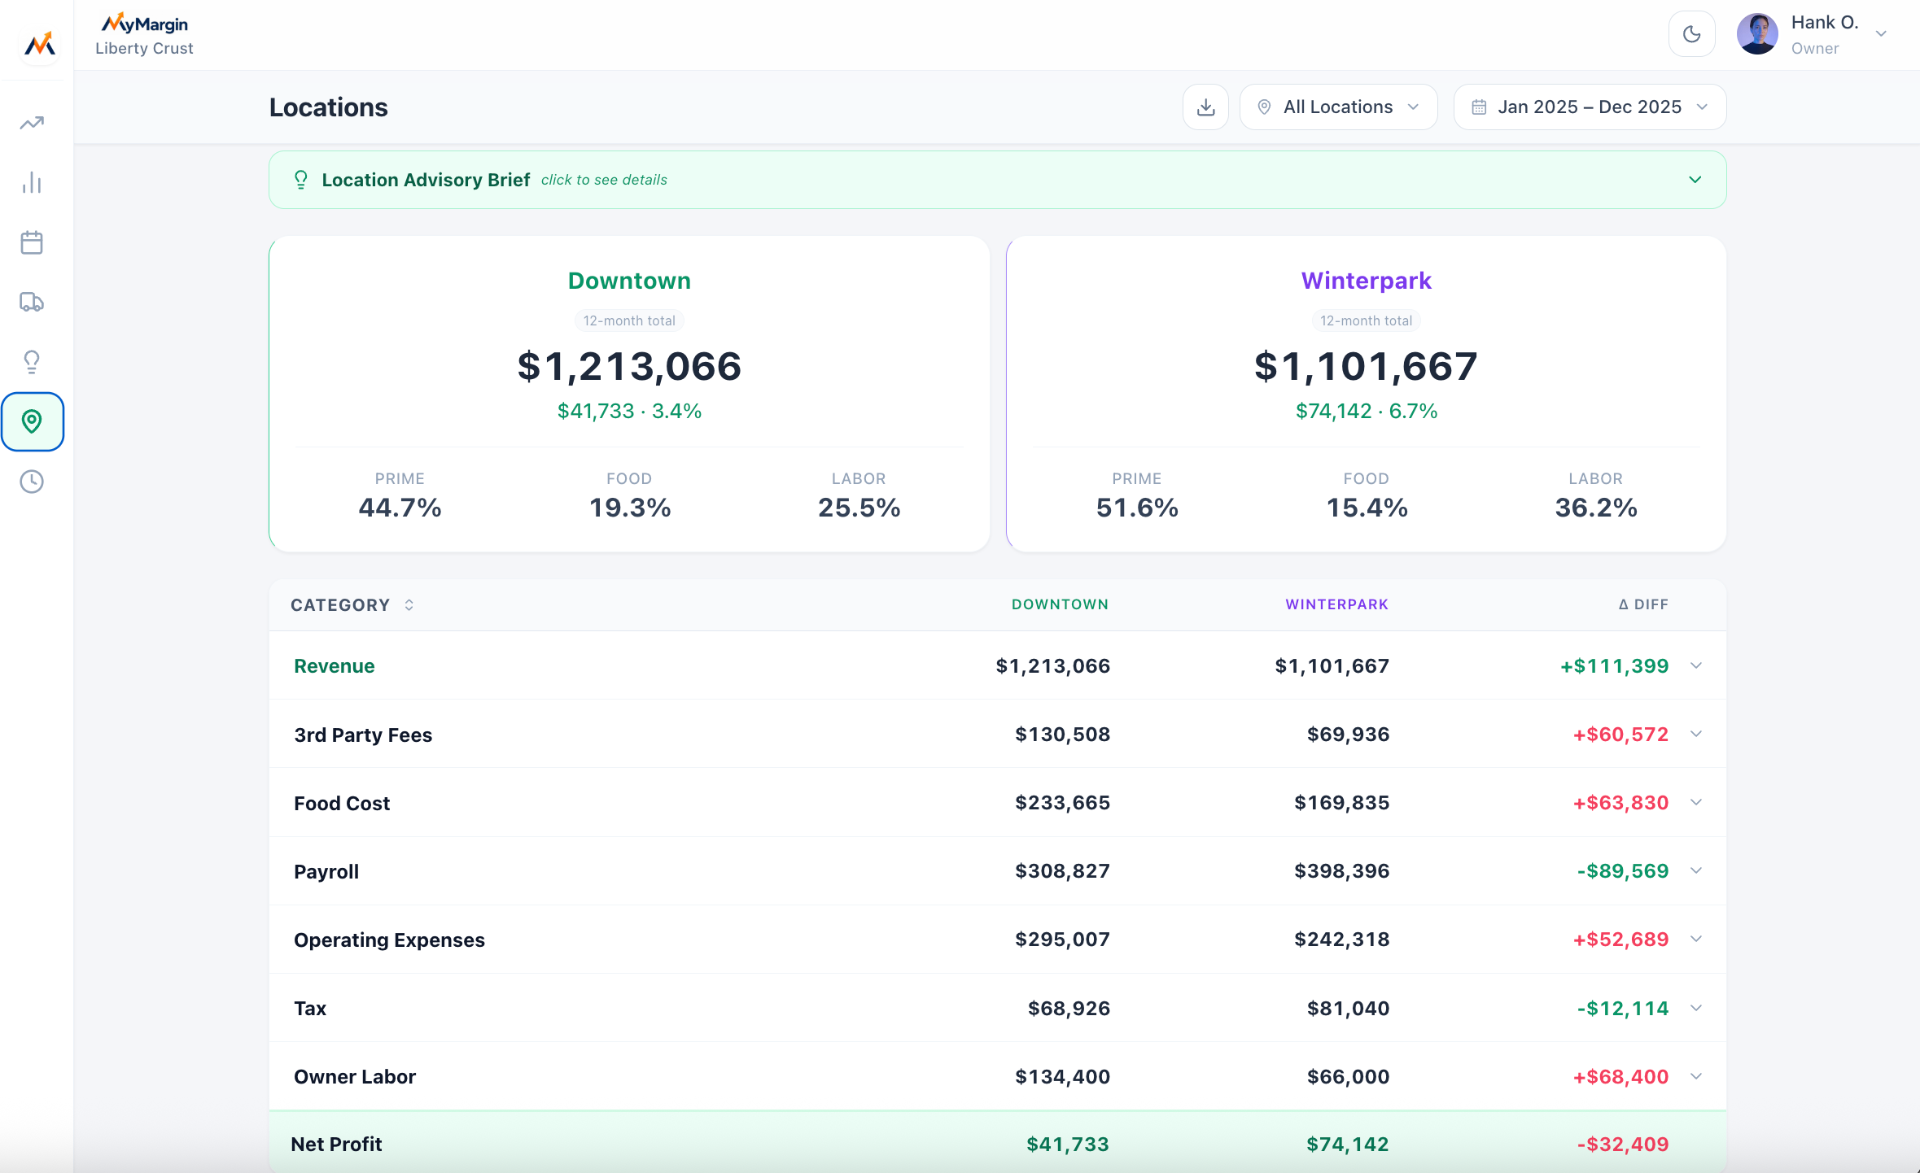
Multi-Location View
Compare locations side by side as you grow.
Roll up performance across cafes, kitchens, and locations — without forcing every site onto a full back-office stack.
Insights
Not just dashboards.
Actionable food business insights.

How it works
No new back-office to build. Just three steps.
Upload or send your data
POS reports, delivery reports, payroll summaries, bank or credit card activity, and expense files.
Margofy organizes your financials
We convert scattered operational and financial data into restaurant-specific reporting categories.
Review your dashboard and insights
See your profitability, margin trends, cost drivers, and recommended action areas.
See it in motion
From scattered files to one clear dashboard
The Gap Margofy Closes
Your sales are tracked. Your profit is still scattered.
Most food business owners already have sales, labor, bank, card, and delivery data. Margofy brings those pieces together into a clear monthly management view of profitability.
Where the data lives
Today
Sales visible. Expenses scattered.
Your POS shows sales and operating activity, while bank, credit card, payroll, and delivery information remain separate.
With Margofy
One monthly profitability view.
See revenue, labor, categorized expenses, margins, and monthly profitability together in one visual dashboard.
Profit visibility
Today
No clear monthly profit picture.
You may operate throughout the year without knowing where margins are being lost or which costs are creating pressure.
With Margofy
Monthly management visibility.
Understand cost pressure, margin trends, and key areas that deserve attention each month.
Effort required
Today
Creating the complete picture takes manual work.
Bringing sales and expenses together usually means maintaining accounting software, categorizing transactions regularly, or paying for recurring bookkeeping support.
With Margofy
Use the files you already receive.
Send your POS sales report, payroll summary, bank statement, and credit card statement. Margofy organizes them into a clear monthly dashboard without requiring accounting software or invoice-by-invoice entry.
Operational & delivery insight
Today
Operational and delivery insights stay separate.
Guest activity, order trends, and third-party delivery payouts may be available, but often require checking different POS reports, portals, or statements separately.
With Margofy
Add deeper insight when data is available.
Provide optional POS operating reports and delivery statements to view guest and order trends, revenue channels, and delivery payout insights alongside your monthly dashboard.
Timing of answers
Today
Answers often wait until tax time.
Statements and transactions may only be organized when they are sent to a CPA at year-end.
With Margofy
Make decisions throughout the year.
Review monthly performance and identify cost pressure before it becomes a year-end surprise.
Owner stories
See profit clearly like these owners
Independent food businesses and small operators using Margofy to turn everyday data into confident financial decisions.

“For the first time I can see my true profit every month — not just sales. We trimmed costs we didn't even know were bleeding us.”

“I used to wait until tax time to understand the numbers. Now my monthly P&L is just there, in plain English.”

“Prime cost tracking changed how we run the kitchen. We spotted the delivery deductions eating our margin in week one.”

“Margofy gave me financial clarity without hiring an accountant or learning enterprise software. It just made sense.”
Why Margofy
Built by people who understand food business profit from the inside.
Margofy brings together real food business operations, Chartered Professional Accountant (CPA) expertise, and modern technology to solve a problem owners know well: having plenty of data, but not enough clarity about where profit is really going.

Restaurant Operations
Founded around the real experience of Hakan, owner of Cucina Pizza & Bar in Downtown Orlando, with firsthand knowledge of restaurant operations, staffing, service, costs, and day-to-day profitability.

Finance-Led Product Development
Designed and built by Serkan, a Canadian Chartered Professional Accountant (CPA) with nearly two decades of experience in finance, audit, reporting, profitability analysis, controls, and executive finance leadership. He combines financial expertise with hands-on product development to turn food business data into practical owner insights.

Technology & Product Support
Designed and built by Sado, who brings nearly twenty years of experience across technology, software development, business analysis, project management, customer success, and business development.
Most food business software tells you what happened.
Margofy helps you understand why it happened, what it means, and what to do next.
Pricing
Simple pricing. No hidden costs.
Get monthly profit visibility without expensive accounting software, complex setup, or enterprise pricing.
Margofy Monthly
IntroductoryInstead of $249/month — available now for $149/month.
- Monthly Profit and Loss (P&L) dashboard
- Sales, expense, and profit trend analysis
- Prime cost visibility
- Labor cost tracking
- Delivery fee and deduction insights
- Expense category breakdown
- Owner-friendly financial insights
- Monthly performance summary
- No hidden costs
- No long-term contract required
Margofy provides monthly management reporting based on the sales, labor, bank, credit card, and optional delivery data you provide. It is designed for business visibility and decision-making, not as a replacement for bookkeeping, tax filing, or formal financial statements.
Ready to see what your food business is really earning?
Book a demo and see how Margofy turns your data into clear insights.